Note
Go to the end to download the full example code.
Plotting segments for a StateVector#
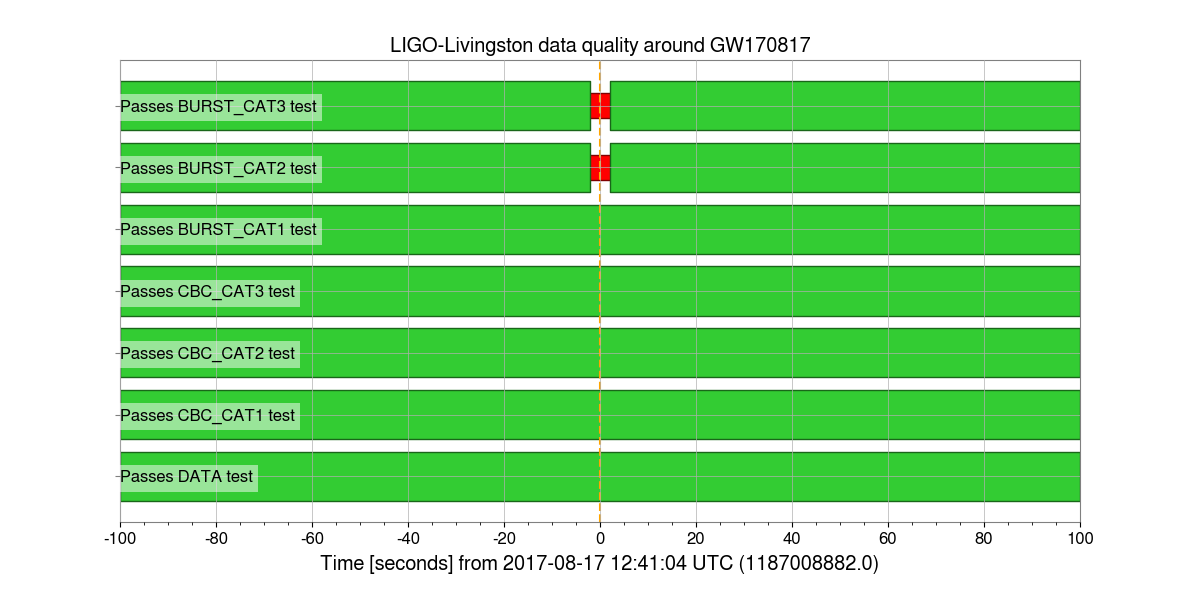
Confident detection of gravitational-wave signals is critically dependent on understanding the quality of the data searched. Alongside the strain h(t) data, GWOSC also releases a Data Quality state vector. We can use this to check on the quality of the data from the LIGO Livingston detector around GW170817.
First, we can import the StateVector class:
from gwpy.timeseries import StateVector
and download the state information surrounding GW170817:
data = StateVector.get(
    "L1",
    1187008882 - 100,
    1187008882 + 100,
)
Finally, we make a plot(), passing insetlabels=True to
display the bit names inside the axes:
print(type(data))
plot = data.plot(insetlabels=True)
ax = plot.gca()
ax.set_xscale("seconds", epoch=1187008882)
ax.axvline(1187008882, color="orange", linestyle="--")
ax.set_title("LIGO-Livingston data quality around GW170817")
plot.show()
<class 'gwpy.timeseries.statevector.StateVector'>
This plot shows that for a short time exactly overlapping with GW170817 there was a data quality issue recorded that would negatively impact a search for generic gravitational-wave transients (bursts). For more details on this glitch, and on how it was excised, please see the science summary for GW170817.
Total running time of the script: (0 minutes 50.525 seconds)