Note
Go to the end to download the full example code.
Comparing seismic trends between LIGO sites#
On Jan 16 2020 there was a series of earthquakes, that should have had an impact on LIGO operations, I’d like to find out.
Data access#
We choose to look at the 0.03Hz-1Hz ground motion band-limited RMS channel (1-second average trends) for each interferometer, which records the low-frequency motion caused by distant earthquakes and similar seismic events. These data are available from the O3 Second-trend Data Release.
We use a format string so we can substitute the interferometer prefix without duplicating the channel name:
To access the data, we can use get(), and give start and end
datetimes to fetch 6 hours of data for each interferometer:
error authenticating against nds.ligo.caltech.edu, attempting Kerberos kinit()
error authenticating against nds.ligo-la.caltech.edu, attempting Kerberos kinit()
Visualisation#
Now that we have the data, we can easily plot them:
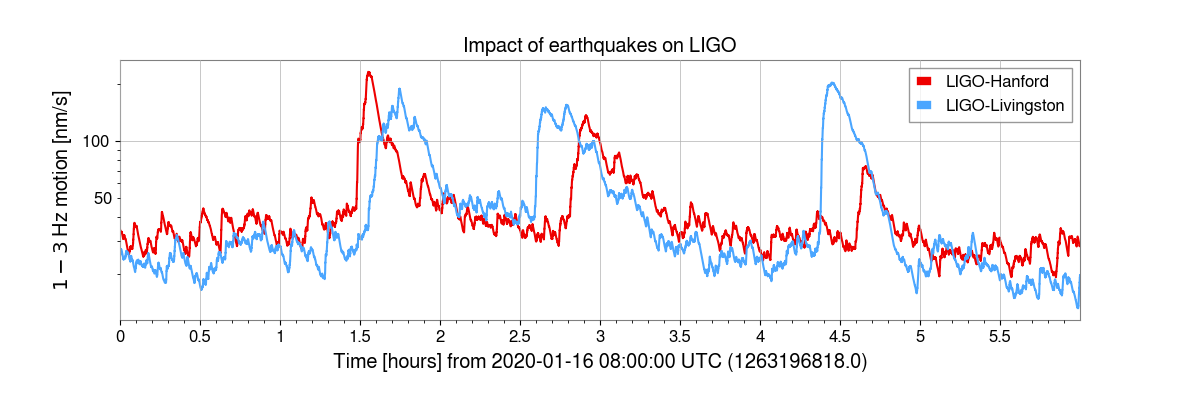
As we can see, a series of earthquakes was recorded over this period, potentially impacting the LIGO observatories for several hours. However, the advanced seismic isolation systems at each site meant that both observatories were able to maintain lock throughout this period.
Total running time of the script: (0 minutes 25.341 seconds)