Spectrogram examples#
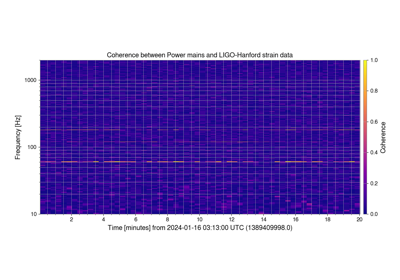
Calculating the time-dependent coherence between two channels
Calculating the time-dependent coherence between two channels
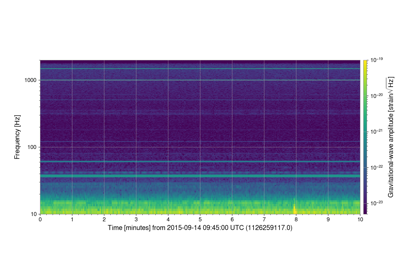
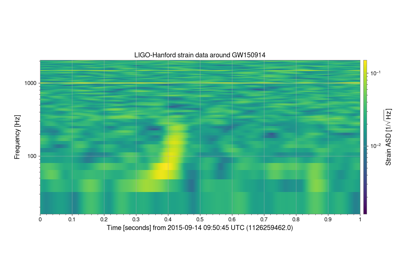
Plotting an over-dense, short-duration Spectrogram
Plotting an over-dense, short-duration Spectrogram