Examples gallery#
GWpy needs more examples!
The GWpy project needs more real-life worked examples to demonstrate the full range of functionality that is available.
If you use GWpy for your research, please consider suggesting a new example to be included in the documentation.
To make a suggestion, please open an issue at
If you have a script that can be converted directly into an example please consider opening a merge request to add it to this gallery.
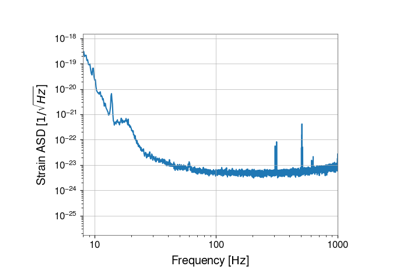
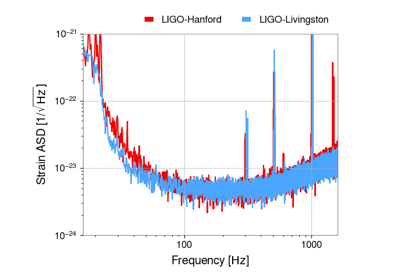
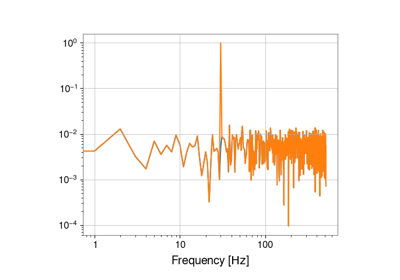
FrequencySeries examples#
Miscellaneous examples#
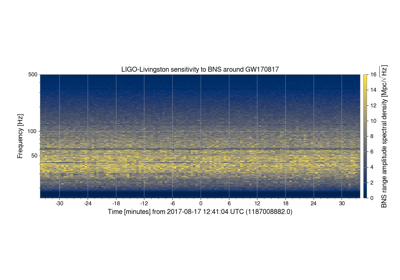
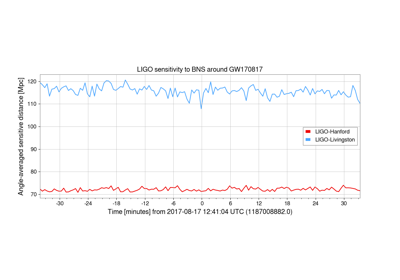
Estimating the spectral contribution to inspiral range
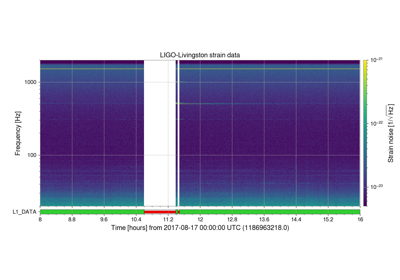
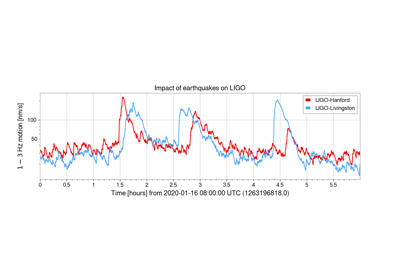
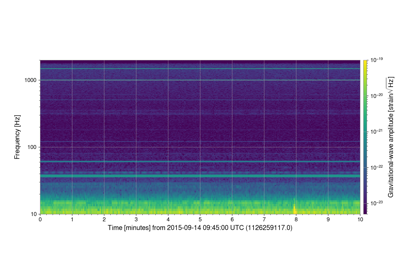
Plotting a spectrogram of all open data for many hours
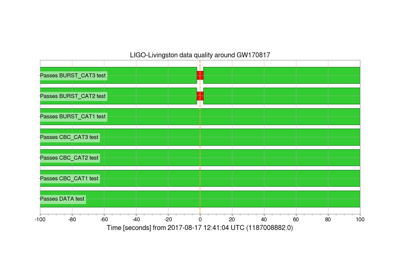
Segments examples#

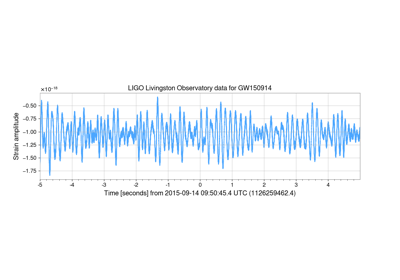
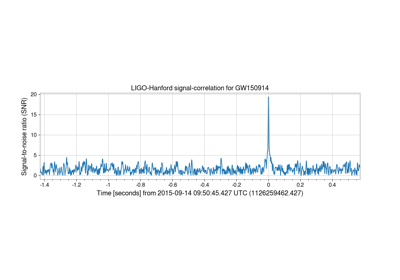
Signal processing examples#
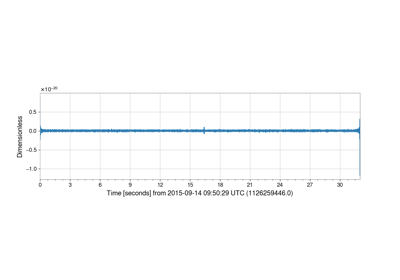
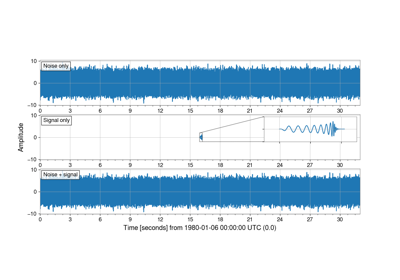
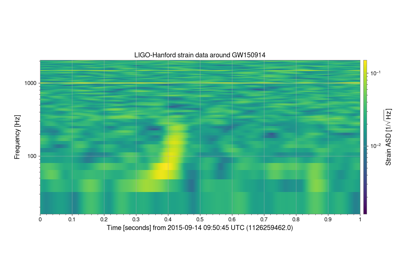
Filtering a TimeSeries to detect gravitational waves
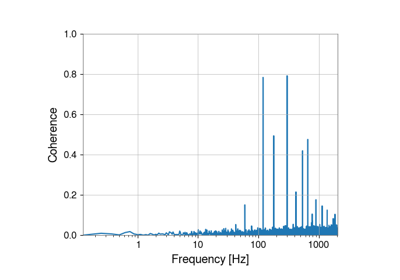
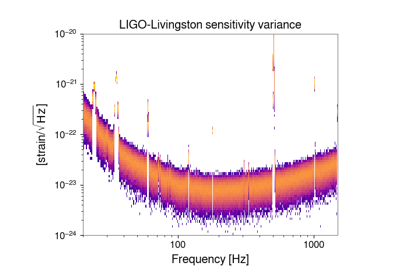
Spectrogram examples#
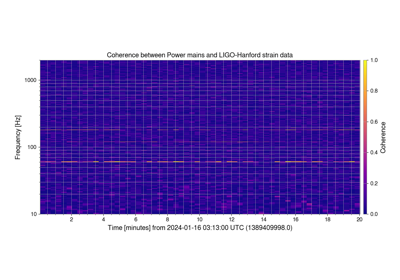
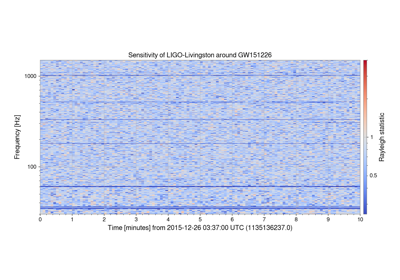
Calculating the time-dependent coherence between two channels
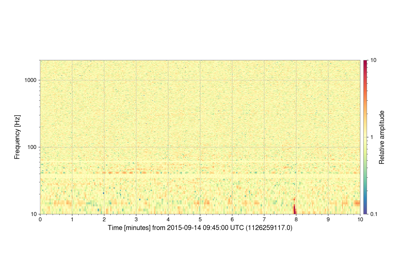
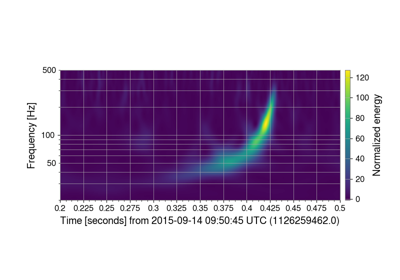
Plotting an over-dense, short-duration Spectrogram
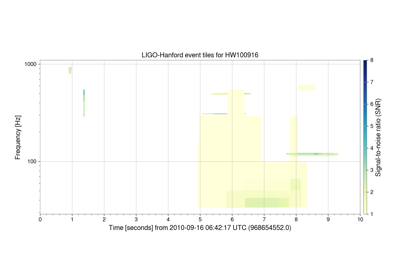
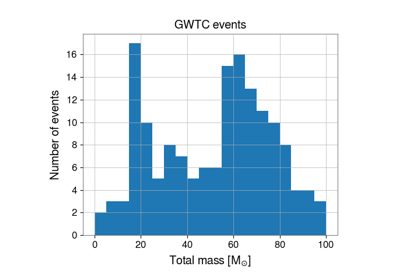
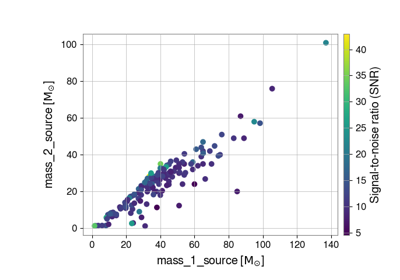
Tabular data examples#
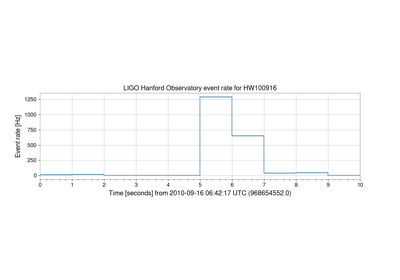
Calculating (and plotting) rate versus time for an EventTable
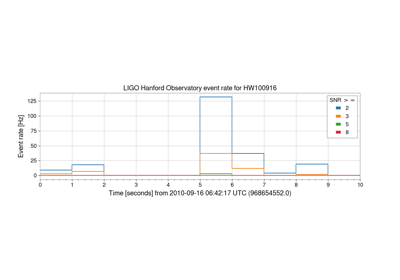
Plotting EventTable rate versus time for specific column bins
TimeSeries examples#
Calculating the SNR associated with an astrophysical signal model