Plotting in GWpy (gwpy.plot)#
Basic plotting#
The gwpy.plot module provides integrated extensions to the fantastic
data visualisation tools provided by Matplotlib.
Basic plotting with pyplot#
Each of the data representations provided by gwpy can be directly passed
to the standard methods available in pyplot:
>>> from gwpy.timeseries import TimeSeries
>>> data = TimeSeries.get('L1', 1126259446, 1126259478)
>>> from matplotlib import pyplot as plt
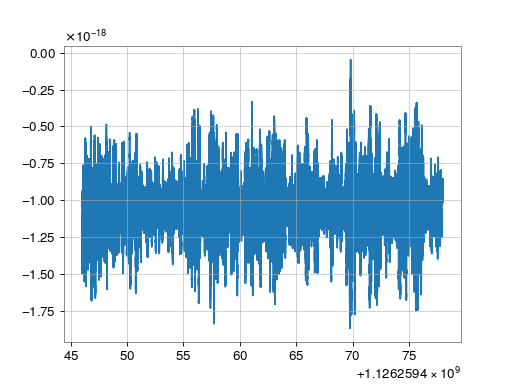
>>> plt.plot(data)
>>> plt.show()
(png)
.plot() instance methods#
Each of the data representations provided by gwpy also come with a
.plot() method that provides a figure with improved defaults tailored
to those data:
>>> from gwpy.timeseries import TimeSeries
>>> data = TimeSeries.get('L1', 1126259446, 1126259478)
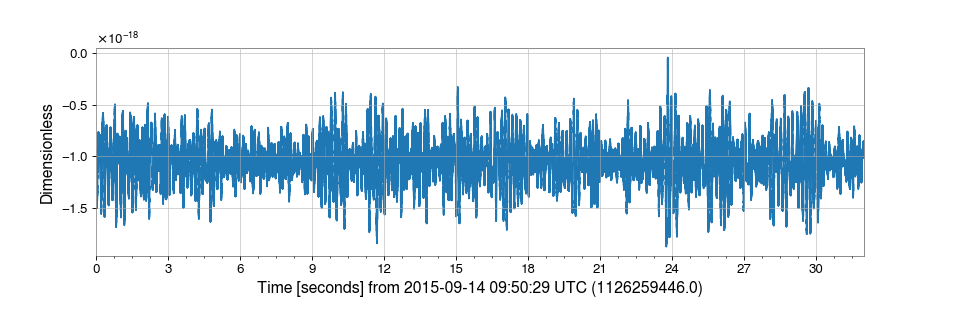
>>> plot = data.plot()
>>> plot.show()
(png)

The .plot() methods accept any keywords that can be used to create the
Figure and the Axes,
and to draw the element itself, e.g:
>>> from gwpy.timeseries import TimeSeries
>>> data = TimeSeries.get('L1', 1126259446, 1126259478)
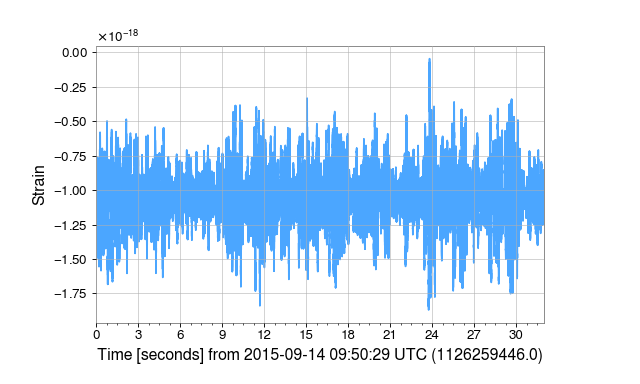
>>> plot = data.plot(figsize=(8, 4.8), ylabel='Strain',
... color='gwpy:ligo-livingston')
>>> plot.show()
(png)
Multi-data plots#
GWpy enables trivial generation of plots with multiple datasets.
The Plot constructor will accept an arbitrary
collection of data objects and will build a figure with the required geometry
automatically.
By default, a flat set of objects are shown on the same axes:
>>> from gwpy.timeseries import TimeSeries
>>> hdata = TimeSeries.get('H1', 1126259446, 1126259478)
>>> ldata = TimeSeries.get('L1', 1126259446, 1126259478)
>>> from gwpy.plot import Plot
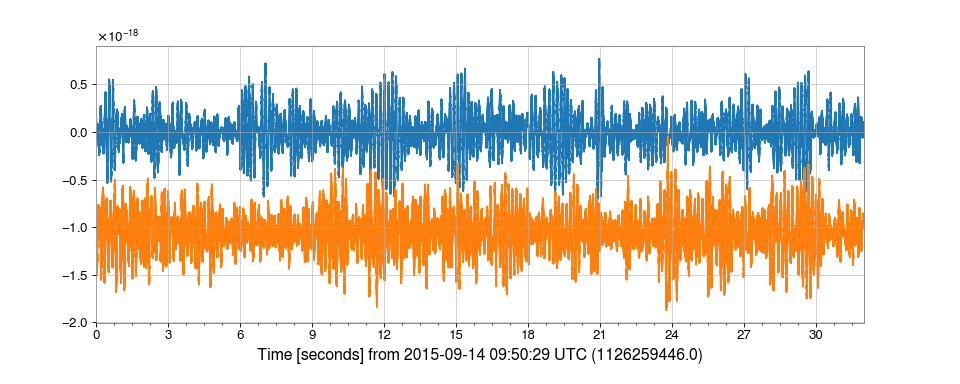
>>> plot = Plot(hdata, ldata, figsize=(12, 4.8))
>>> plot.show()
(png)

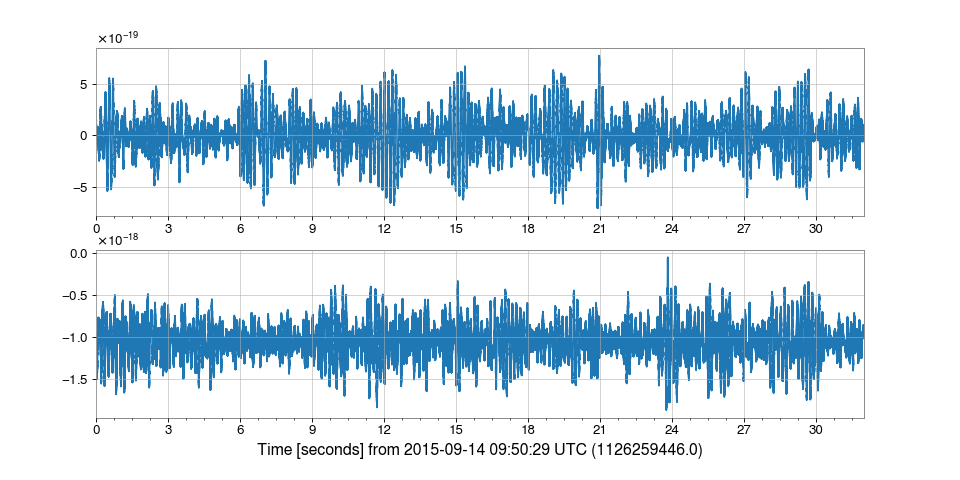
However, separate=True can be given to show each dataset on a separate
Axes:
>>> plot = Plot(hdata, ldata, figsize=(12, 6), separate=True, sharex=True)
>>> plot.show()
(png)

Warning
The Plot constructor can only handle one plotting method at any time
(e.g. ax.plot(), ax.imshow()), so you can’t create plots with
a line and an image using this call,
for example.