Note
Go to the end to download the full example code.
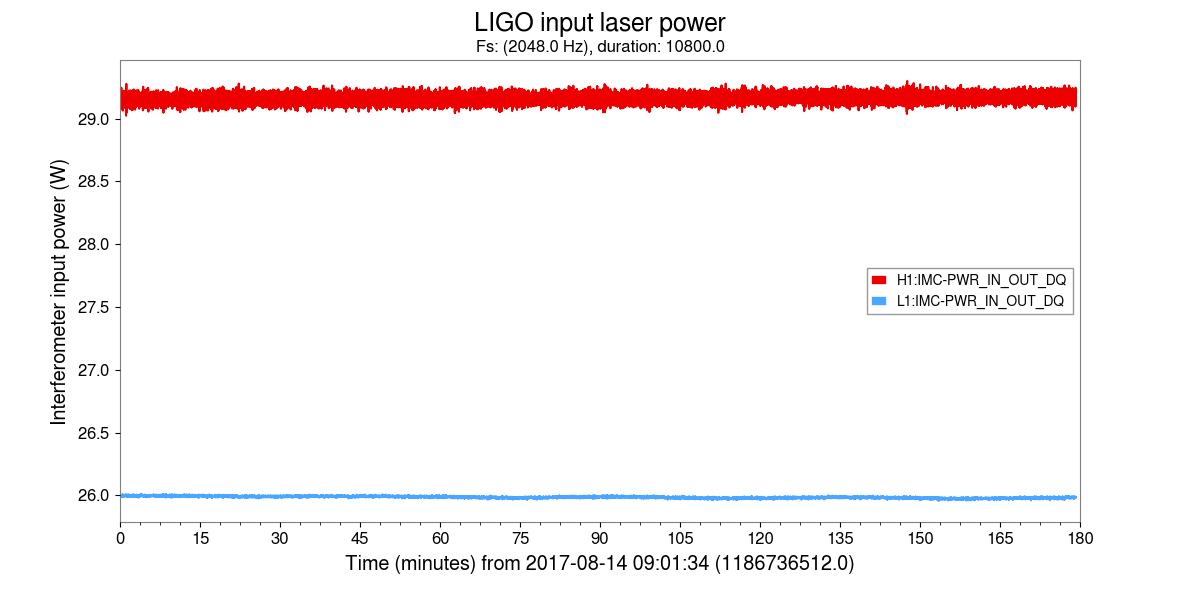
Time-series of input laser power#
This example shows the input laser power (W) for each LIGO Detector for three hours around GW170817 (data taken from the Auxiliary Channel Three Hour Release).
gwpy-plot timeseries \
    --chan H1:IMC-PWR_IN_OUT_DQ \
    --chan L1:IMC-PWR_IN_OUT_DQ \
    --start 1186736512 \
    --duration 3hour \
    --ylabel 'Interferometer input power (W)' \
    --suptitle 'LIGO input laser power' \
    --interactive
The same command can be executed directly in Python as:
from gwpy.cli.gwpy_plot import main
main([
    'timeseries',
    '--chan', 'H1:IMC-PWR_IN_OUT_DQ',
    '--chan', 'L1:IMC-PWR_IN_OUT_DQ',
    '--start', '1186736512',
    '--duration', '3hour',
    '--ylabel', 'Interferometer input power (W)',
    '--suptitle', 'LIGO input laser power',
    '--interactive',
])
/home/docs/checkouts/readthedocs.org/user_builds/gwpy/checkouts/v4.0.0/gwpy/cli/timeseries.py:131: UserWarning: TimeSeries.crop given end larger than current end, crop will begin when the Series actually ends.
  cropped = [ts.crop(self.args.xmin, self.args.xmax) for

0
Total running time of the script: (0 minutes 48.623 seconds)