Getting Started#
Welcome to GWpy! This guide will help you get up and running quickly.
Install GWpy using conda or pip, and learn about system requirements.
Your first GWpy program - load, filter, and plot gravitational-wave data.
Understand the core ideas behind GWpy’s design and data structures.
What is GWpy?#
GWpy is a Python package for analyzing data from gravitational-wave detectors like LIGO and Virgo. It provides:
- Easy Data Access
Read data from multiple sources including public archives, detector data systems, and file formats.
- Powerful Analysis Tools
Filter signals, compute spectra, generate spectrograms, and more - all with simple Python methods.
- Beautiful Visualizations
Create publication-quality plots with sensible defaults and extensive customization options.
- Built on Standards
Extends NumPy, integrates with Astropy, and leverages SciPy and Matplotlib.
Quick Taste#
Here’s GWpy in action - detecting the first gravitational wave (GW150914):
from gwpy.timeseries import TimeSeries

# Get data around GW150914
hdata = TimeSeries.get("H1", 1126259446, 1126259478)

# Bandpass filter (50-250 Hz) and notch out mains power lines
filtered = hdata.bandpass(50, 250).notch(60).notch(120)

# Plot the result
plot = filtered.plot(
    xlim=(1126259461, 1126259463),
    ylim=(-1e-21, 1e-21),
)
plot.show()
(png)
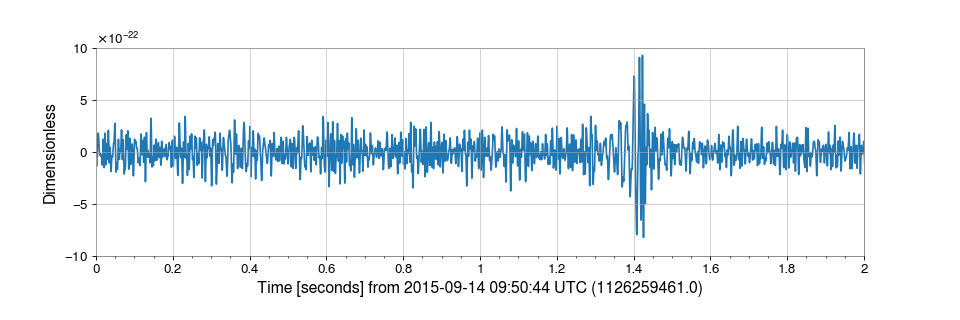
That’s it! In just 4 lines of code, you’ve downloaded real gravitational-wave data and prepared it for analysis.
Ready to Learn More?#
Need Help?#
Questions? Join our Slack community
Found a bug? Report it on GitLab
Want to contribute? See our contributing guide