Plot#
- class gwpy.plot.Plot(*data: ArrayLike | IterableType, **kwargs)[source]#
Bases:
FigureAn extension of the core matplotlib
Figure.The
Plotprovides a number of methods to simplify generating figures from GWpy data objects, and modifying them on-the-fly in interactive mode.Methods Summary
add_segments_bar(segments[, ax, height, ...])Add a segment bar
Plotindicating state information.close()Close the plot and release its memory.
colorbar([mappable, cax, ax, fraction, emit])Add a colorbar to the current
Plot.get_axes([projection])Find all
Axes, optionally matching the given projection.refresh()Refresh the current figure.
save(fname, **kwargs)Save the figure to disk.
set(*[, agg_filter, alpha, animated, ...])Set multiple properties at once.
show([warn, block])Display the current figure (if possible).
Methods Documentation
- add_segments_bar(
- segments: DataQualityFlag,
- ax: Axes | None = None,
- height: float = 0.14,
- pad: float = 0.1,
- *,
- sharex: bool = True,
- location: Literal['top', 'bottom'] = 'bottom',
- **plotargs,
Add a segment bar
Plotindicating state information.By default, segments are displayed in a thin horizontal set of Axes sitting immediately below the x-axis of the main, similarly to a colorbar.
- Parameters:
- segments
DataQualityFlag A data-quality flag, or
SegmentListdenoting state segments about this Plot.- ax
Axes, optional Specific
Axesrelative to which to position newAxes, defaults togca().- height
float, optional Height of the new axes, as a fraction of the anchor axes.
- pad
float, optional Padding between the new axes and the anchor, as a fraction of the anchor axes dimension.
- sharex
True,Axes, optional Either
Trueto setsharex=axfor the new segment axes, or anAxesto use directly.- location
str, optional Location for new segment axes, defaults to
'bottom', acceptable values are'top'or'bottom'.- plotargs
Other keyword arguments are passed to
plot().
- segments
See also
SegmentAxesFor more details about segment axes.
- colorbar(
- mappable: Collection | AxesImage | None = None,
- *,
- cax: Axes | None = None,
- ax: Axes | None = None,
- fraction: float = 0.0,
- emit: bool = True,
- **kwargs,
Add a colorbar to the current
Plot.This method differs from the default
matplotlib.figure.Figure.colorbar()in that it doesn’t resize the parentAxesto accommodate the colorbar, but rather draws a new Axes alongside it.- Parameters:
- mappable
AxesImage,Collection, optional Collection against which to map the colorbar. Default is the most-recently-added mappable artist.
- cax
Axes, optional Axes on which to draw colorbar. By default a new
Axeswill be created.- ax
Axes Axes relative to which to position colorbar. The default is the
Axescontaining themappable.- fraction
float, optional Fraction of original axes to use for colorbar. The default (
fraction=0) is to not resize the original axes at all.- emit
bool, optional If
Trueupdate all mappables onAxesto match the same colouring as the colorbar.- kwargs
Other keyword arguments are passed to
colorbar().
- mappable
- Returns:
- cbar
Colorbar The newly added
Colorbar.
- cbar
Notes
To revert to the default matplotlib behaviour, pass
fraction=0.15.Examples
>>> import numpy
>>> from gwpy.plot import Plot
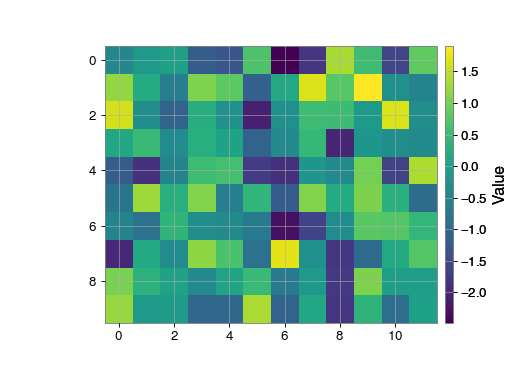
To plot a simple image and add a colorbar:
>>> plot = Plot()
>>> ax = plot.gca()
>>> ax.imshow(numpy.random.randn(120).reshape((10, 12)))
>>> plot.colorbar(label='Value')
>>> plot.show()
Colorbars can also be generated by directly referencing the parent axes:
>>> Plot = Plot()
>>> ax = plot.gca()
>>> ax.imshow(numpy.random.randn(120).reshape((10, 12)))
>>> ax.colorbar(label='Value')
>>> plot.show()

- get_axes(projection: str | None = None) list[Axes][source]#
Find all
Axes, optionally matching the given projection.
- save(fname: str | Path | BinaryIO, **kwargs) None[source]#
Save the figure to disk.
This method is an alias to
savefig(), all arguments are passed directory to that method.
- set(
- *,
- agg_filter=<UNSET>,
- alpha=<UNSET>,
- animated=<UNSET>,
- canvas=<UNSET>,
- clip_box=<UNSET>,
- clip_on=<UNSET>,
- clip_path=<UNSET>,
- constrained_layout=<UNSET>,
- constrained_layout_pads=<UNSET>,
- dpi=<UNSET>,
- edgecolor=<UNSET>,
- facecolor=<UNSET>,
- figheight=<UNSET>,
- figwidth=<UNSET>,
- frameon=<UNSET>,
- gid=<UNSET>,
- in_layout=<UNSET>,
- label=<UNSET>,
- layout_engine=<UNSET>,
- linewidth=<UNSET>,
- mouseover=<UNSET>,
- path_effects=<UNSET>,
- picker=<UNSET>,
- rasterized=<UNSET>,
- size_inches=<UNSET>,
- sketch_params=<UNSET>,
- snap=<UNSET>,
- tight_layout=<UNSET>,
- transform=<UNSET>,
- url=<UNSET>,
- visible=<UNSET>,
- zorder=<UNSET>,
Set multiple properties at once.
Supported properties are
- Properties:
agg_filter: a filter function, which takes a (m, n, 3) float array and a dpi value, and returns a (m, n, 3) array and two offsets from the bottom left corner of the image alpha: float or None animated: bool canvas: FigureCanvas clip_box:
BboxBaseor None clip_on: bool clip_path: Patch or (Path, Transform) or None constrained_layout: unknown constrained_layout_pads: unknown dpi: float edgecolor: color facecolor: color figheight: float figure: unknown figwidth: float frameon: bool gid: str in_layout: bool label: object layout_engine: {‘constrained’, ‘compressed’, ‘tight’, ‘none’,LayoutEngine, None} linewidth: number mouseover: bool path_effects: list ofAbstractPathEffectpicker: None or bool or float or callable rasterized: bool size_inches: (float, float) or float sketch_params: (scale: float, length: float, randomness: float) snap: bool or None tight_layout: unknown transform:Transformurl: str visible: bool zorder: float
- show(warn: bool = True, block: bool | None = None) None[source]#
Display the current figure (if possible).
If blocking, this method replicates the behaviour of
matplotlib.pyplot.show(), otherwise it just calls up toshow().This method also supports repeatedly showing the same figure, even after closing the display window, which isn’t supported by
pyplot.show(AFAIK).- Parameters:
- block
bool, optional open the figure and block until the figure is closed, otherwise open the figure as a detached window, default:
None. IfNone, block if using an interactive backend and _not_ inside IPython.- warn
bool, optional print a warning if matplotlib is not running in an interactive backend and cannot display the figure, default:
True.
- block