Calculating event trigger rate#
Simple event rate#
For discrete data in the form of event triggers, it is often very
illuminating to analyse the rate at which these events occur in time -
usually a high event rate is indicative of a higher noise level.
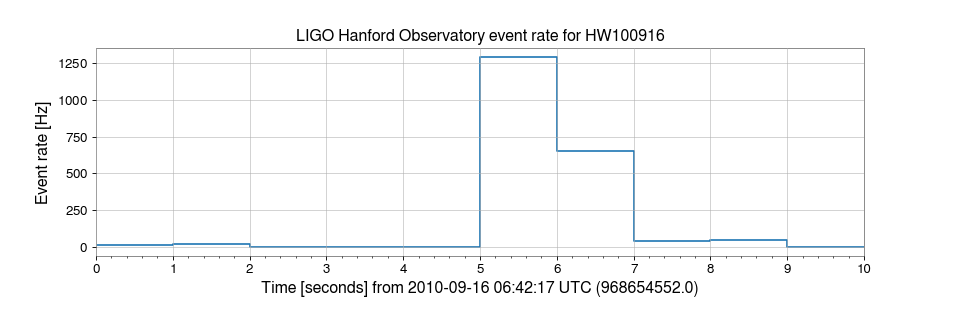
One can calculate the event rate of an EventTable via the
event_rate() method.
For example, using the same data as before we can calculate and plot the event rate on a 1-second stride:
>>> from gwpy.table import EventTable
>>> events = EventTable.read('H1-LDAS_STRAIN-968654552-10.xml.gz', tablename='sngl_burst', columns=['peak', 'central_freq', 'snr'])
>>> rate = events.event_rate(1, start=968654552, end=968654562, timecolumn='peak')
>>> plot = rate.step()
>>> ax = plot.gca()
>>> ax.set_ylabel('Event rate [Hz]')
>>> ax.set_title('LIGO Hanford Observatory event rate for HW100916')
>>> plot.show()
(png)

This code is a snippet of the example Calculating (and plotting) rate versus time for an EventTable.
Binned event rate#
Following from a simple rate versus time calculation, it is often useful
to calculate the event rate for multiple conditions on the same table.
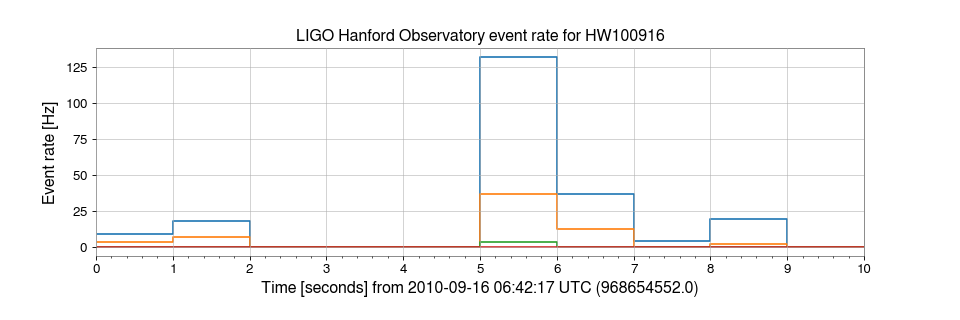
For this, we can use the binned_event_rates() method.
For example, in the following example, we calculate the rate of events with signal-to-noise ratio (SNR) above some threshold, for the same table as above.
>>> rates = events.binned_event_rates(1, 'snr', [2, 3, 5, 8], operator='>=', start=968654552, end=968654562, timecolumn='peak')
>>> plot = rates.step()
>>> ax = plot.gca()
>>> ax.set_ylabel('Event rate [Hz]')
>>> ax.set_title('LIGO Hanford Observatory event rate for HW100916')
>>> plot.show()
This code is a snippet of the example on Plotting EventTable rate versus time for specific column bins.