highpass#
- gwpy.signal.filter_design.highpass(
- frequency: QuantityLike,
- sample_rate: QuantityLike,
- fstop: float | None = None,
- gpass: float = 2,
- gstop: float = 30,
- type: Literal['iir'] = 'iir',
- output: Literal['zpk'] = 'zpk',
- **kwargs,
- gwpy.signal.filter_design.highpass(
- frequency: QuantityLike,
- sample_rate: QuantityLike,
- fstop: float | None = None,
- gpass: float = 2,
- gstop: float = 30,
- type: Literal['iir'] = 'iir',
- output: Literal['ba'] = 'ba',
- **kwargs,
- gwpy.signal.filter_design.highpass(
- frequency: QuantityLike,
- sample_rate: QuantityLike,
- fstop: float | None = None,
- gpass: float = 2,
- gstop: float = 30,
- type: Literal['iir'] = 'iir',
- output: Literal['sos'] = 'sos',
- **kwargs,
- gwpy.signal.filter_design.highpass(
- frequency: QuantityLike,
- sample_rate: QuantityLike,
- fstop: float | None = None,
- gpass: float = 2,
- gstop: float = 30,
- type: Literal['fir'] = 'fir',
- **kwargs,
Design a high-pass filter for the given cutoff frequency.
- Parameters:
- frequency
float,Quantity Corner frequency of high-pass filter.
- sample_rate
float,Quantity Sampling rate of target data.
- fstop
float Edge-frequency of stop-band.
- gpass
float The maximum loss in the passband (dB)
- gstop
float The minimum attenuation in the stopband (dB).
- type
str The filter type, either
'iir'or'fir'.- output
str, optional, default:'zpk' The output format for an IIR filter, either
'zpk','ba', or'sos'.- kwargs
Other keyword arguments are passed directly to
iirdesign()orfirwin().
- frequency
- Returns:
filterThe formatted filter. The output format for an IIR filter depends on the input arguments, default is a tuple of
(zeros, poles, gain).
Notes
By default a digital filter is returned, meaning the zeros and poles are given in the Z-domain in units of radians/sample.
Examples
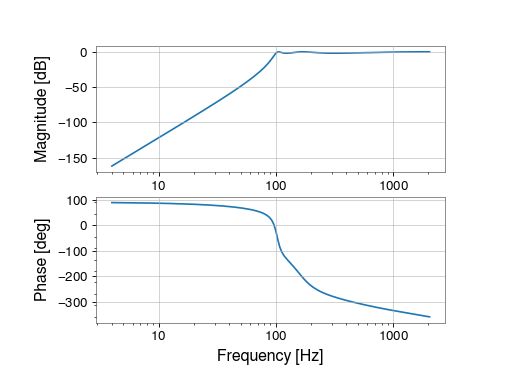
To create a high-pass filter at 100 Hz for 4096 Hz-sampled data:
>>> from gwpy.signal.filter_design import highpass
>>> hp = highpass(100, 4096)
To view the filter, you can use the
BodePlot:>>> from gwpy.plot import BodePlot >>> plot = BodePlot(hp, sample_rate=4096) >>> plot.show()
(
png)