Note
Go to the end to download the full example code.
Estimating the spectral contribution to inspiral range#
Generating an inspiral range timeseries shows how the binary neutron star (BNS) inspiral range of a gravitational-wave detector can be measured directly from the strain readout.
In this example, we estimate the average spectral
contribution to BNS range from the strain record surrounding GW170817
using gwpy.astro.range_spectrogram().
Data access#
First, we need to load some data.
For this we can fetch the public data
around the GW170817 BNS merger:
from gwpy.timeseries import TimeSeries
l1 = TimeSeries.get("L1", 1187006834, 1187010930)
Generate a range Spectrogram#
Then, we can calculate a Spectrogram of the inspiral range
amplitude spectrum:
from gwpy.astro import range_spectrogram
l1spec = range_spectrogram(l1, 30, fftlength=4, fmin=15, fmax=500) ** (1./2)
/home/docs/checkouts/readthedocs.org/user_builds/gwpy/conda/v4.0.1/lib/python3.13/site-packages/inspiral_range/inspiral_range.py:27: SyntaxWarning: invalid escape sequence '\i'
  \int_fmin^fmax df f^(-7/3) / psd
Visualisation#
We can plot this Spectrogram to visualise spectral variation in
LIGO-Livingston’s sensitivity in the hour or so surrounding GW170817:
plot = l1spec.plot(figsize=(12, 5))
ax = plot.gca()
ax.set_yscale("log")
ax.set_ylim(15, 500)
ax.set_title("LIGO-Livingston sensitivity to BNS around GW170817")
ax.set_epoch(1187008882)  # <- set 0 on plot to GW170817
ax.colorbar(
    cmap="cividis",
    clim=(0, 16),
    label=r"BNS range amplitude spectral density [Mpc/$\sqrt{\mathrm{Hz}}$]",
)
plot.show()
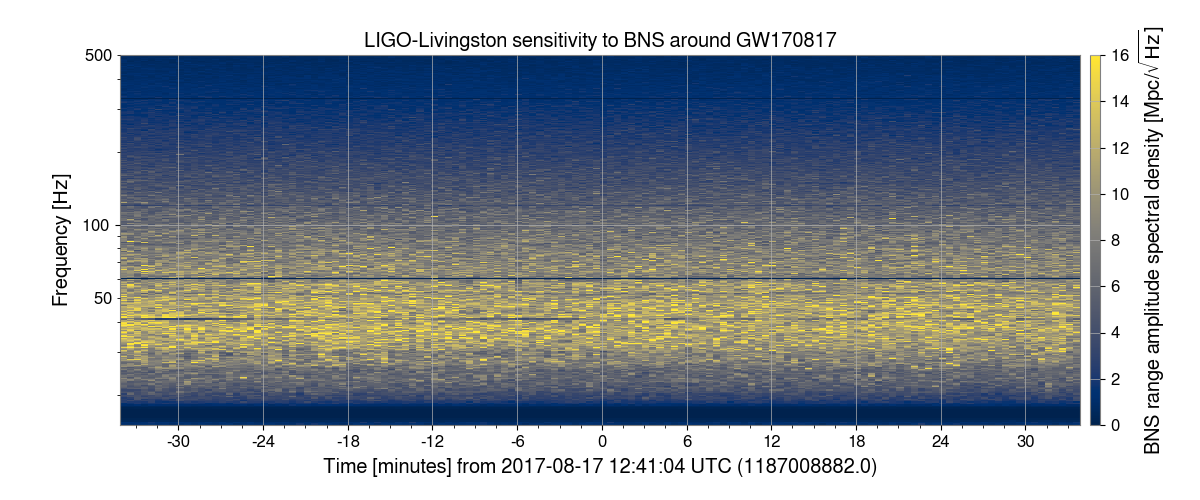
Note, the extreme dip in sensitivity near GW170817 is caused by a loud, transient noise event, see Phys. Rev. Lett. vol. 119, p. 161101 for more information.
Total running time of the script: (0 minutes 7.263 seconds)