Plotting (gwpy.plot)#
Utilities for visualising GW data with Matplotlib.
The standard data types (TimeSeries, Table, DataQualityFlag, …) can
all be easily visualised using the relevant plotting objects, with
many configurable parameters both interactive, and in saving to disk.
See also
User Guide: Plotting in GWpy (gwpy.plot)
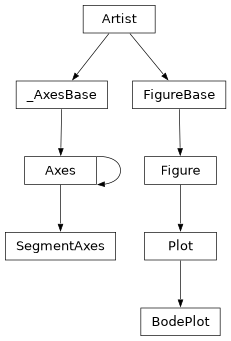
Classes#
Class Inheritance Diagram#