Note
Go to the end to download the full example code.
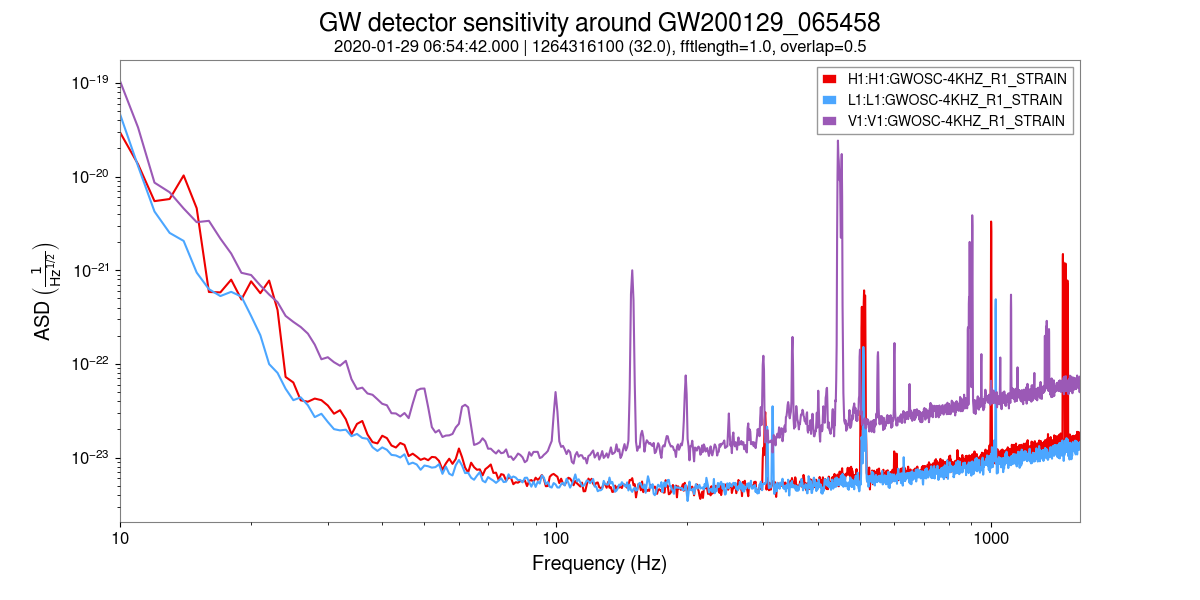
Spectrum with three interferometers#
This example shows the spectrum (power spectral density) of strain data for the three active detectors around GW200129_065458 (see Gravitational-Wave Transient Catalogue (GWTC) 3 for full details).
gwpy-plot spectrum \
    --gwosc \
    --ifo H1 L1 V1 \
    --start 1264316100 \
    --duration 32 \
    --xmin 10 \
    --xmax 1600 \
    --suptitle "GW detector sensitivity around GW200129_065458" \
    --interactive
The same command can be executed directly in Python as:
from gwpy.cli.gwpy_plot import main
main([
    'spectrum',
    '--gwosc',
    '--ifo', 'H1', 'L1', 'V1',
    '--start', '1264316100',
    '--duration', '32',
    '--xmin', '10',
    '--xmax', '1600',
    '--suptitle', 'GW detector sensitivity around GW200129_065458',
    '--interactive',
])
0
Total running time of the script: (0 minutes 5.577 seconds)